Almost 70 percent of
Japan’s social welfare spending is directed at people 65 or older, while less
than 4 percent supports children and families, according to a
government-affiliated research group.
Thursday, February 28, 2013
Monday, February 25, 2013
Just another earthquake
As can be seen on the website of the Japan Meteorological Agency, another earthquake with shindou 5+ has occurred nearby. Supposedly it was shindou 2 in our region, but larger earthquakes always last much longer and shake in seemingly more directions (convalescing waves?) than the smaller ones. Again, shindou 5 is when it's possible items fall off shelves, so only when it's shindou 5 or up in our area something actually might affect daily life other than, oh, it's an earthquake. The first five months upon arrival were definitely more eventful than the latest five months have been. Let's hope it stays that way.

| Occurred at (JST) | Latitude (degree) | Longitude (degree) | Depth | Magnitude | Region Name |
| 16:23 JST 25 Feb 2013 | 36.9N | 139.4E | 10 km | 6.2 | Tochigi-ken Hokubu |
Wednesday, February 13, 2013
Lessons from Hurricane Sandy
The newest issue of the Magazine for National Security and Crisis Management of the Netherlands has a 2-page special about lessons learned from hurricane Sandy. It is downloadable here, in Dutch (page 50-51).
The article mainly refers to five previously made Dutch studies which already had recommendations to improve New York City's disaster prevention. The lessons drawn remain relevant however, and include:
-building codes for areas outside FEMA designated flood plains as other models show these areas will also flood
-adapting the building codes to expected climate change by including the long term risks
-more stringent requirements for buildings with a high social function
-research cheaper measures than raising buildings during scheduled renovations
-use spatial planning to stimulate developing safe areas
-prioritize protecting vital infrastructure such as metro lines
Investing in a more robust infrastructure, such as a levee system comparable to the Dutch situation, would cost around 15-25 billion euro and is seen as politically sensitive given the current economic crisis.
Friday, February 8, 2013
Earthquakes in the Netherlands
On the one hand, earthquakes in the Netherlands aren't that much of a big deal. The Royal Dutch Meteorological Institute (KNMI) registers all earthquakes. The latest 30 earthquakes are listed below, "G" meaning induced. Nearly all have occurred in the North, in the province Groningen, and are induced by gas extraction.
The third column represents the magnitude and are not particularly high. However, imagine you have built your house in what is known to be an earthquake free zone, so there are no special building regulations enforced to protect your house, school, work office, supermarket, etc. against earthquake. Although the gas drilling and extraction has been taking place since 1986, the earthquakes are now increasing in magnitude and frequency, and your house is even becoming damaged from these small quakes.
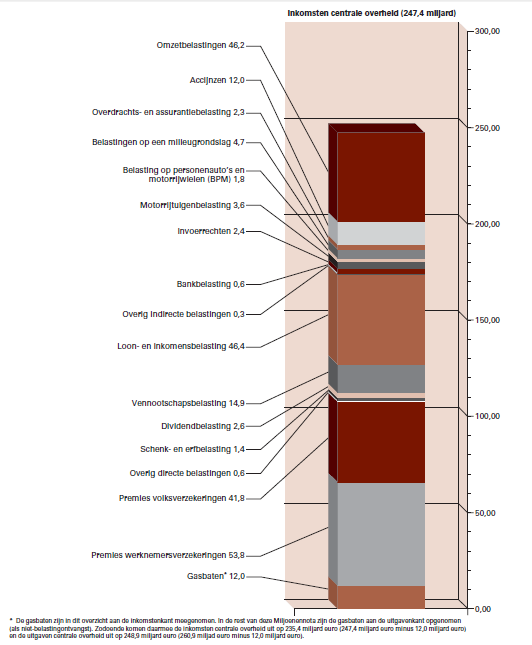
Just two weeks ago the Dutch Petroleum Company (NAM, Nederlandse Aardolie Maatschappij) responded to research from the KNMI that indicated the magnitudes of the earthquakes were likely to increase to 4 or 5, by reserving a 100 million euro to enforce fragile structures. Minister Kamp of Economic Affairs does not want to restrict the gas extraction but prefers to wait for the results of further investigations. The main reason is that 97% of Dutch households are dependent on this gas. In 2012 47 billion cubic meter gas was extracted and also exported to neighboring countries Germany, Belgium and France. This gave the Dutch government a profit of 11.5 billion euro. Comparing this to the total of governmental income, income from gas extraction is about 4.6% (see image below, gasbaten 12,0). The NAM has made a user-friendly website to report damages to your house and share experiences, but this doesn't affect the causes of the induced earthquakes.

The third column represents the magnitude and are not particularly high. However, imagine you have built your house in what is known to be an earthquake free zone, so there are no special building regulations enforced to protect your house, school, work office, supermarket, etc. against earthquake. Although the gas drilling and extraction has been taking place since 1986, the earthquakes are now increasing in magnitude and frequency, and your house is even becoming damaged from these small quakes.
Just two weeks ago the Dutch Petroleum Company (NAM, Nederlandse Aardolie Maatschappij) responded to research from the KNMI that indicated the magnitudes of the earthquakes were likely to increase to 4 or 5, by reserving a 100 million euro to enforce fragile structures. Minister Kamp of Economic Affairs does not want to restrict the gas extraction but prefers to wait for the results of further investigations. The main reason is that 97% of Dutch households are dependent on this gas. In 2012 47 billion cubic meter gas was extracted and also exported to neighboring countries Germany, Belgium and France. This gave the Dutch government a profit of 11.5 billion euro. Comparing this to the total of governmental income, income from gas extraction is about 4.6% (see image below, gasbaten 12,0). The NAM has made a user-friendly website to report damages to your house and share experiences, but this doesn't affect the causes of the induced earthquakes.
Wednesday, February 6, 2013
ICHARM member visit to USA for Hurricane Sandy Damage Investigation
The results below match well with the excellent survey conducted by the New York Times on the location and cause of death of the victims of Hurricane Sandy. It shows that males have a higher mortality risk after disaster, when they are conducting rescue or cleanup activities. It also proves the vulnerability of the New York transportation and pumping system, as was already known, in books as "The World Without Us" by Alan Weisman.
From the ICHARM Newsletter:
ICHARM Researcher Conducts Hurricane Sandy Damage Investigation
ICHARM Research Specialist Megumi Sugimoto visited the United States for the Hurricane Sandy Damage Investigation in November 2012. She has contributed a brief report of the investigation as follows: Hurricane Sandy hit the eastern coast of the United States and caused devastation there during October 29-31 2012, killing 113 people. I investigated affected areas during November 20-23. When I arrived there about one month after the disaster, I saw people still distributing relief supplies.

(Written by Megumi Sugimoto, Project led by Toshio Okazumi)
From the ICHARM Newsletter:
ICHARM Researcher Conducts Hurricane Sandy Damage Investigation
ICHARM Research Specialist Megumi Sugimoto visited the United States for the Hurricane Sandy Damage Investigation in November 2012. She has contributed a brief report of the investigation as follows: Hurricane Sandy hit the eastern coast of the United States and caused devastation there during October 29-31 2012, killing 113 people. I investigated affected areas during November 20-23. When I arrived there about one month after the disaster, I saw people still distributing relief supplies.
Overview of damage: Hurricane Sandy landed somewhere
near Atlantic City in the state of New Jersey around 20:00 (EST) in October 29
with a maximum wind speed of about 36 m/s (NOAA). The twoday rainfall was reported
to have reached 160mm and the water level rose up to 4m (monthly mean rainfall:
88.1mm). The economic losses were estimated at 50 billion dollars (EQECA).
Hurricane Sandy became the first hurricane of this size that ever hit New York
since 1938. From several days before its landing, the city halted economic
activities and repeatedly issued an evacuation advisory. The effort is thought
to have resulted in saving disaster vulnerable people such as seniors and
children while men in 50s marked the highest fatality in the disaster (Figure
1), which is very different from the case of the Great East Japan Earthquake
and Tsunami (GEJET). In addition, according to the New York City Police
Department, the top cause of their deaths is accidents including electrocution,
being hit by falling trees and traffic accidents, rather than drowning.

Urbanization as vulnerability: Even about
one month after the disaster, some stations on two subway lines were still
closed because they were still inundated by sea water. Also closed were many
condominiums for retired seniors built on sunny, coastal areas. Even
superhigh-rise condominiums at the tip of the Manhattan Island were closed, for
their electric facilities had been flooded because they are in the basement. Consultants
told me that only two buildings in Manhattan (one of them is Goldman Sachs’)
survived a widespread inundation because they had taken flood prevention
measures. The Gurdian reported that infrastructures were seriously damaged by
flooding because prevention measures were largely ignored in New York despite
that its disaster management committee had repeatedly warned of the city’s
flood vulnerability in its reports since 2005.
Nuclear Power Plant: At the Oyster Creek
nuclear power plant, a level-2 warning was issued regarding the storm; the
warning was the second lowest of the four-level warning system currently
employed for nuclear facilities in the United States. What surprised me was
that there were no levees along the river that the plant uses for water intake
and discharge (Photo 2). This reminded me of some nuclear facilities in Japan
built by foreign constructors that have been pointed out for not having
adequate protection against water hazards. Such facilities, though built in a
different environment, may have been regulated in a similar way that they are
regulated in the original environment.
Conclusion: In this investigation, I saw
many cases that typically originated in the ignorance of taking necessary
measures for urban vulnerability to certain hazards. It is very important that
we should take a close look at the investigation results for lessons to improve
urban resilience to various hazards such as a powerful inland earthquake
expected to occur in the Tokyo metropolitan area and in other parts of Japan.
(Written by Megumi Sugimoto, Project led by Toshio Okazumi)
Tuesday, February 5, 2013
Safety norms and actual status of Dutch levees
The image below shows the flood safety norms in the Dutch Water Law, ranging from 1:250 years in the South East to 1:10,000 years in the West. However, these norms are theoretical.

The third report of the status of levee and related infrastructure is downloadable (in Dutch) here. Results show that only 61% of the levees is confirmed to satisfy the norms. 33% does not satisfy the safety norms. In the images below, green means the levee of infrastructure object complies with the norms, red means it does not, and blue means additional research is required, which is scheduled to be finished at the end of this year.

Examples of infrastructure objects include: aquaduct, bridge, pumping station, sluice, tunnel, culvert (暗渠), weir (堰).
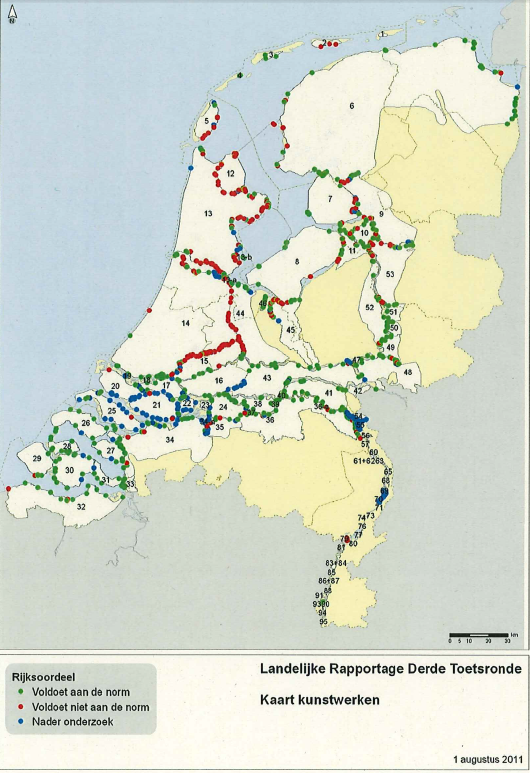
The table below shows different columns, starting with the provinces (Starting with Flevoland), the total number of km of dykes and levees in that province, the amount of km of levee that is within the norms (voldoet), the amount that is not (voldoet niet), and the amount of km that requires more research (nader onderzoek).

Subscribe to:
Posts (Atom)